Traffic Counting from Survey Video
What it is: a tool that turns roadside survey video into a classified traffic count, in the 15-minute format that traffic-data suppliers and local authorities use. Built: October 2026, as an independent build. I directed the work and reviewed the code. I ship with agentic tooling. Status: running as an always-on service on my own machine. Not a client deployment.
What kind of AI this is: applied computer vision. It is not a chatbot. A detection model finds vehicles, a vision-language model (CLIP) helps decide their class, and ordinary code does the counting, timing and export. The language-model part of the project is the way I built it: with Claude Code, reading and reviewing every change.
The Problem
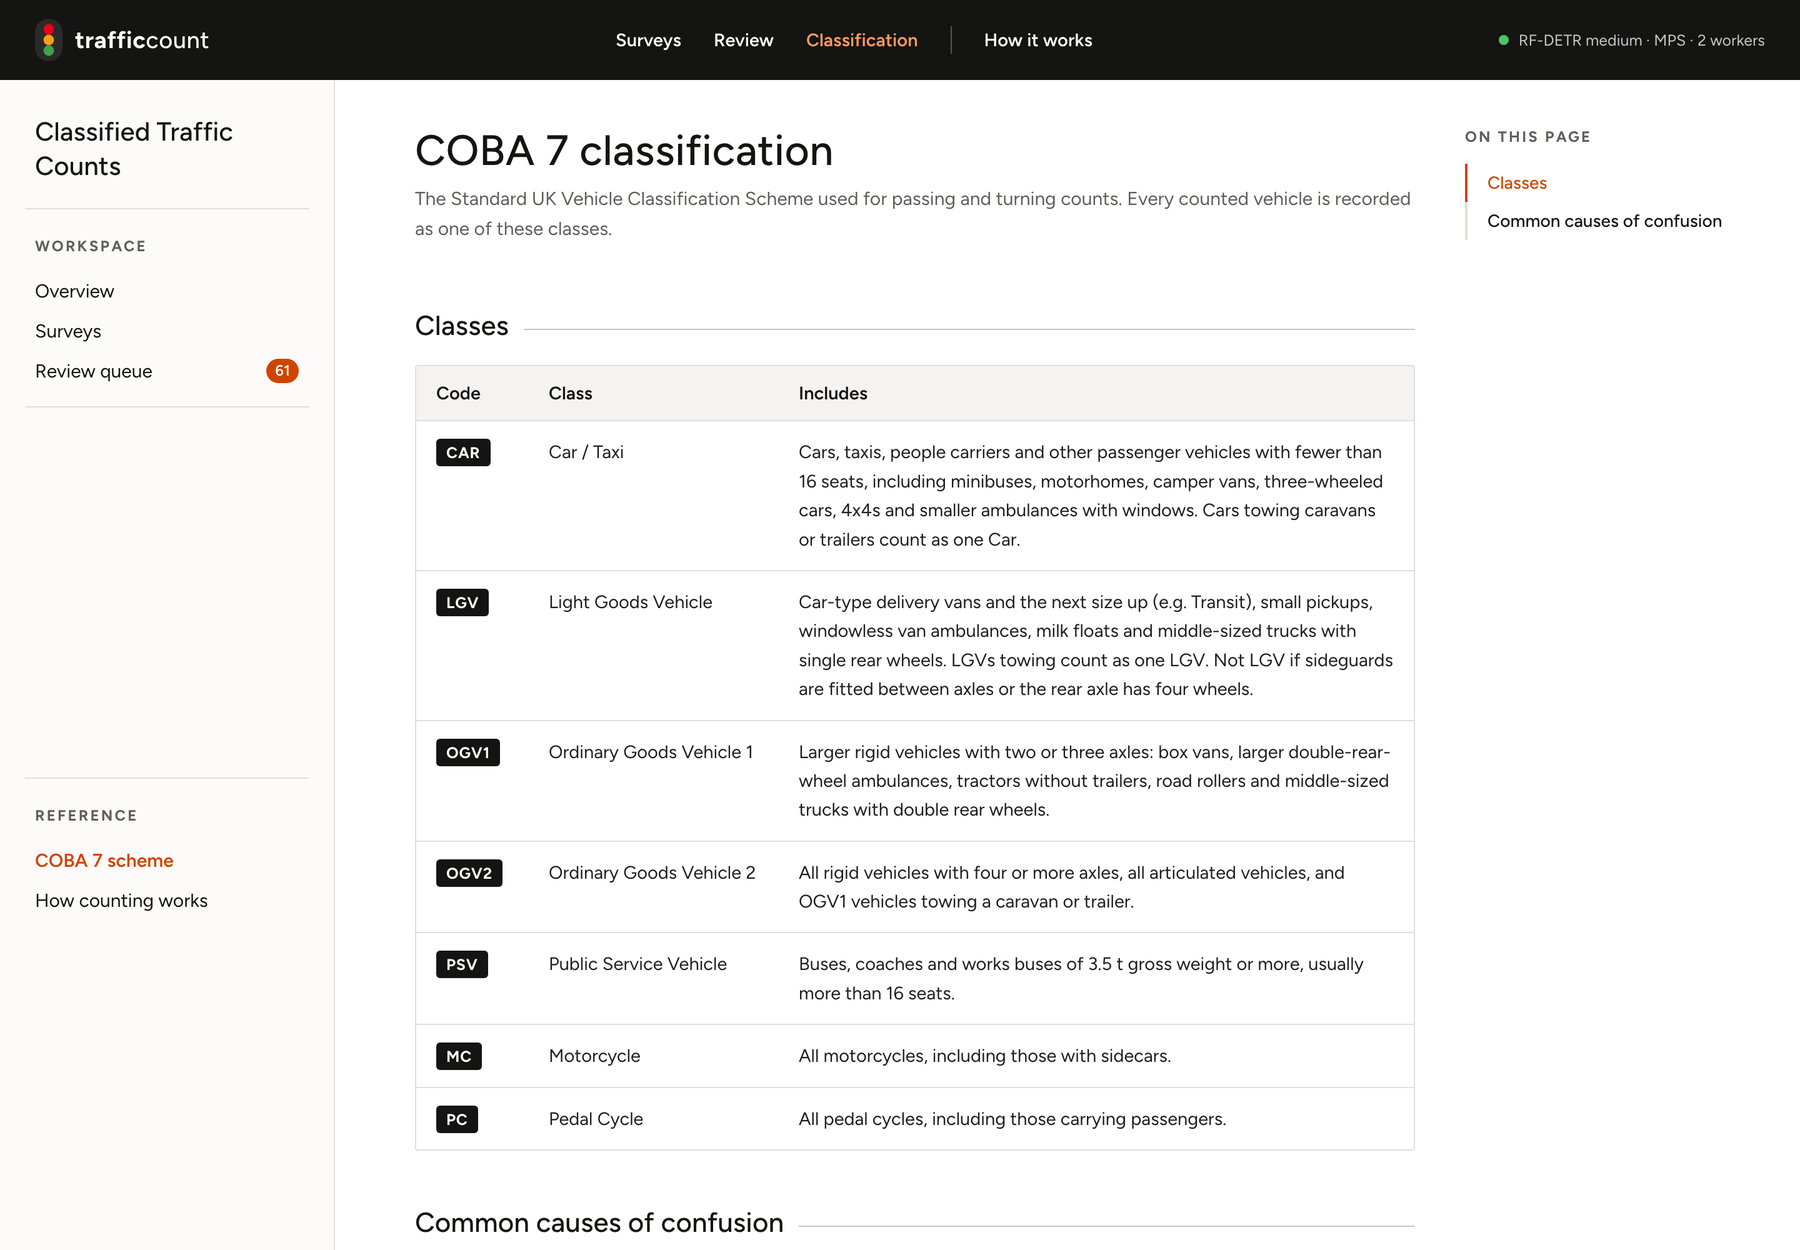
Councils commission classified traffic counts to see how many vehicles use a road, which direction they travel and what kind they are. The standard is COBA 7: cars, light goods vehicles, two kinds of heavier goods vehicle, buses, motorcycles and pedal cycles.
Counting this by hand from video is slow and tiring. A 12-hour recording takes longer than 12 hours to count, and people drift. The output has to match a fixed spreadsheet template, 15 minutes at a time, for each direction and class.
What I Built
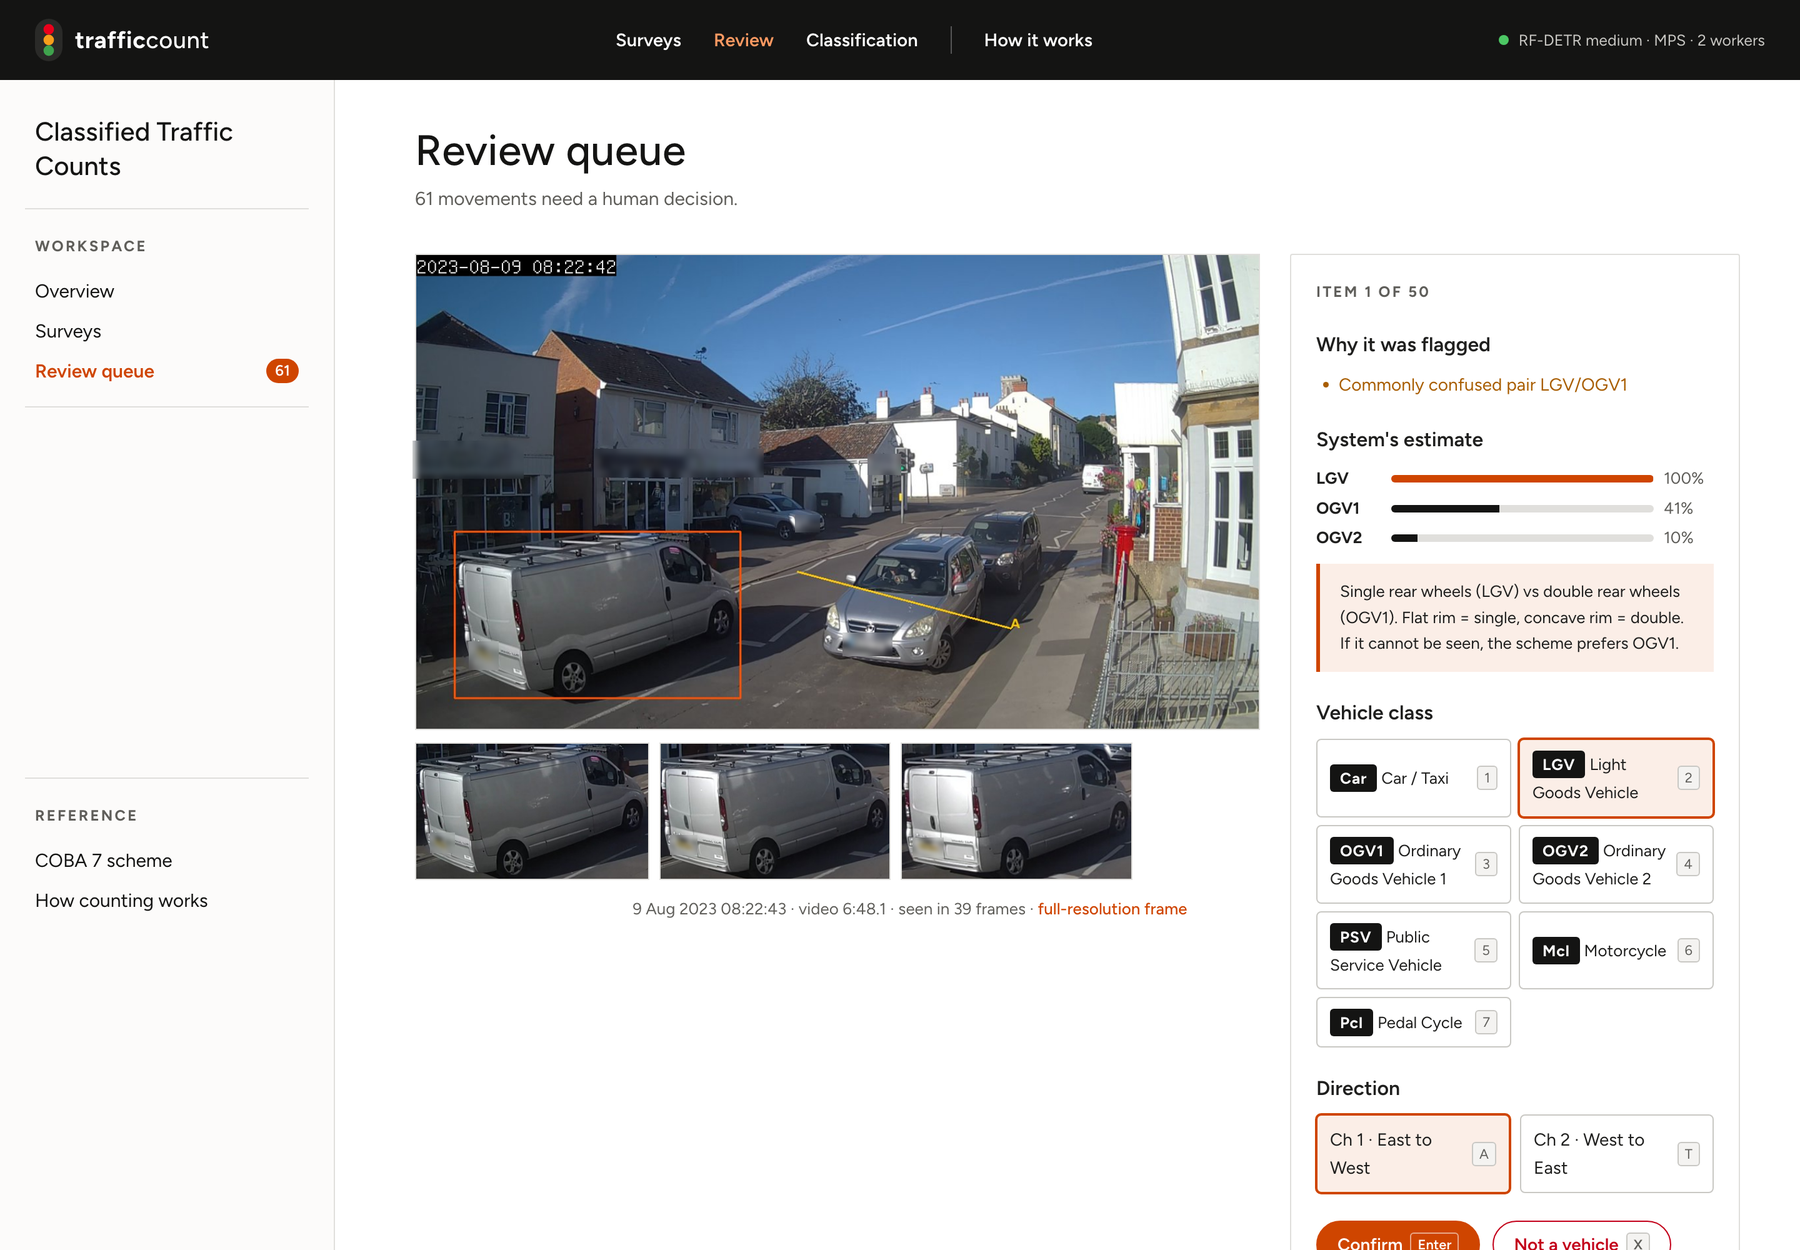
The review queue. Number plates and place names are blurred in every image on this page.
You upload the video and drag a count line across the road. The system does the rest and flags only the vehicles it is genuinely unsure about. A person confirms those with one key. The result exports to the 15-minute passing-count template, with one sheet for each direction.
How It Works
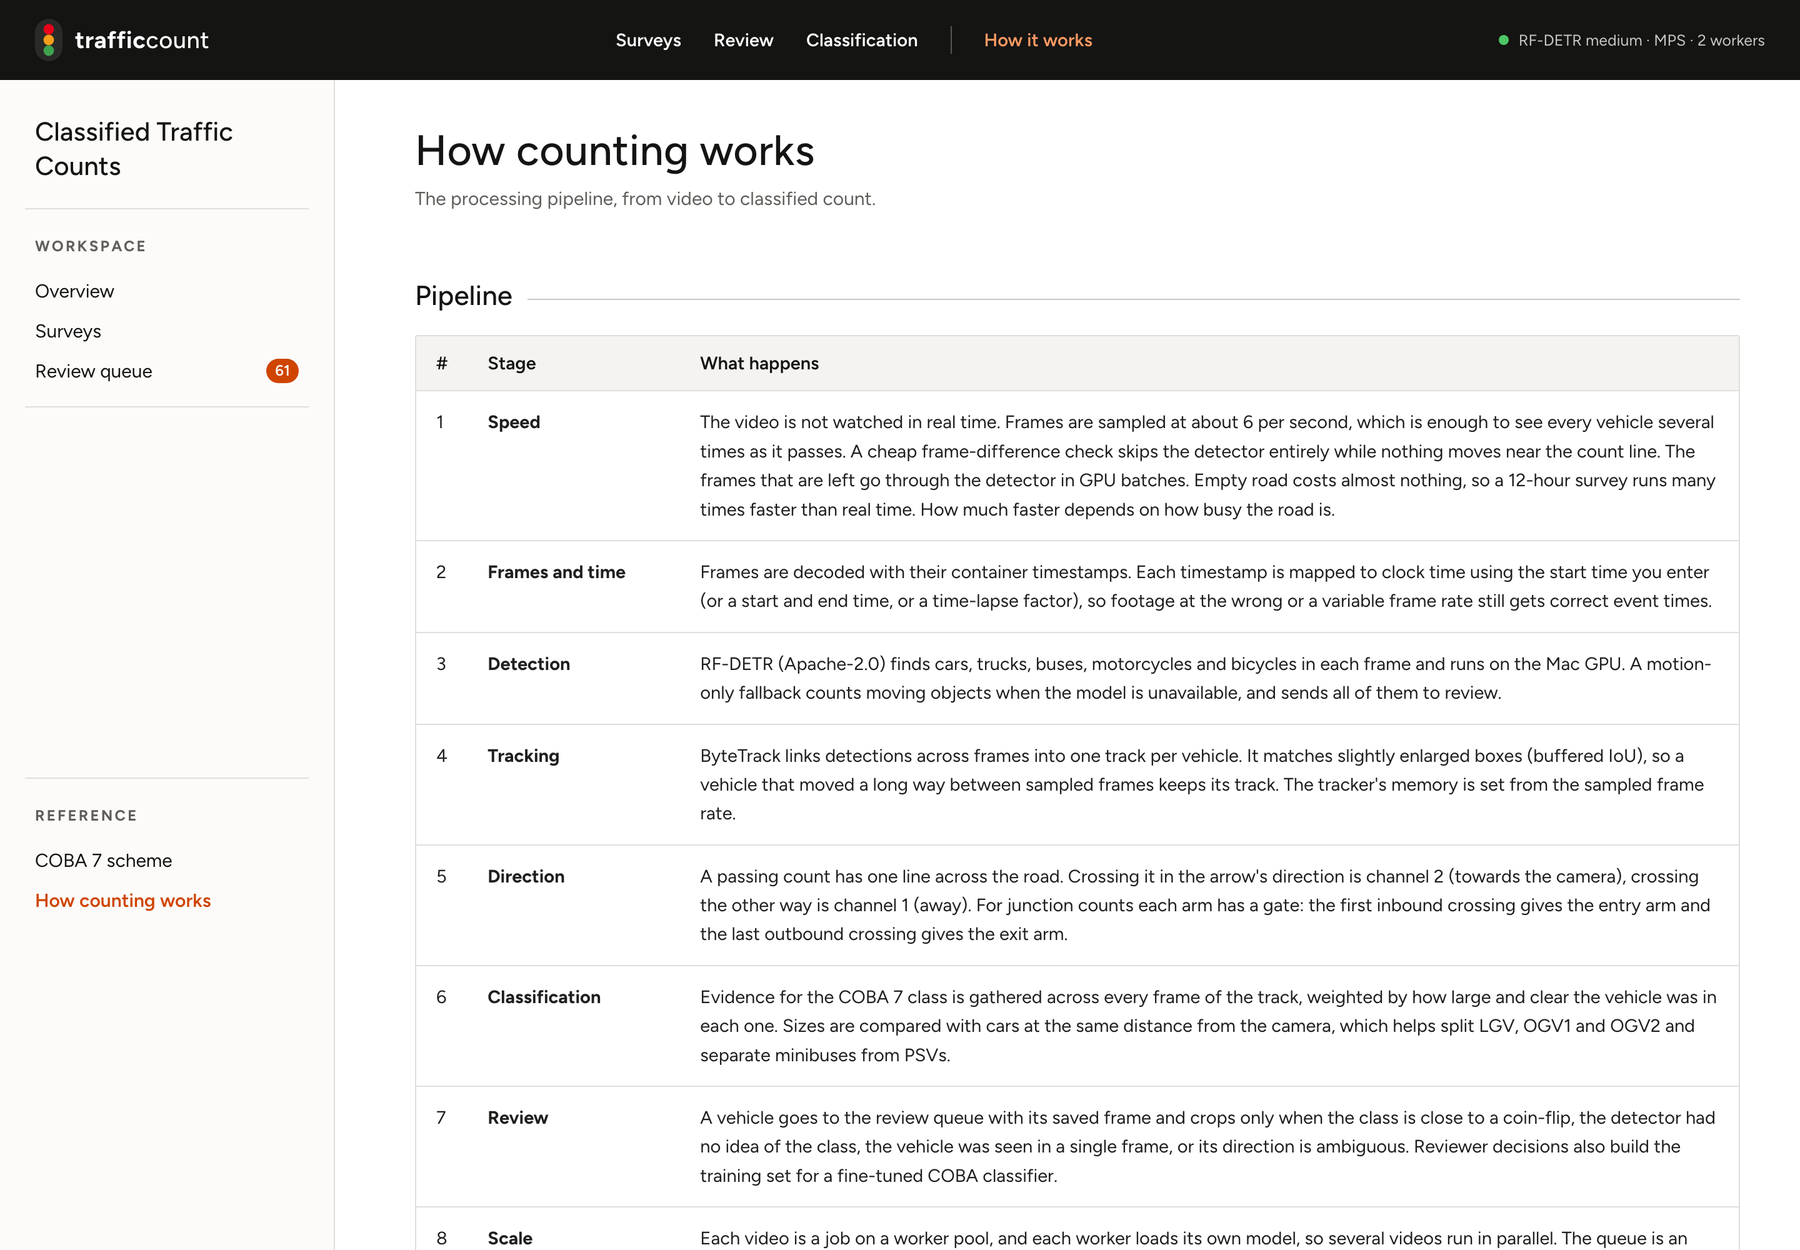
- Sampling. The video is not watched in real time. Frames are sampled several times a second and a cheap frame-difference check skips empty road. A 12-hour survey runs many times faster than real time.
- Detection and tracking. RF-DETR finds vehicles and ByteTrack links them across frames into one track per vehicle.
- Direction. A track that crosses the count line is counted once, with hysteresis so a vehicle sitting on the line is not counted twice.
- Class. Evidence for the COBA 7 class is gathered across every frame of the track. A CLIP zero-shot check on the saved crop separates vans from lorries and rejects pedestrians.
- Time. Most surveys have a date and time stamp burned into the picture. The system reads it by template matching and uses it as the only trusted clock, because recordings get slowed down, sped up and joined together.
- Review. A vehicle goes to a person only when the class is close to a coin flip, the detector had no idea, or the direction is unclear.
- Export. The Drakewell passing-count template, 15-minute rows by class.
How I Measured Accuracy
I did not want to tune the system until it agreed with itself. The method was fixed before the final run:
- A manual count of the same day as the reference.
- 15-minute segments. Each segment is counted for real and compared with the manual row straight away.
- A mismatch stops the line. I find the root cause and change the code in a general way. I never adjust results to fit.
- Held-out windows. A threshold tuned on the morning was tested on the afternoon, and both scores are reported.
The Result
On one full survey day, from 06:45 to 19:12, the machine counted 2,914 vehicles against 2,994 in the manual count. That is 97.3% of the total, a 2.7% undercount.
- The mean agreement per 15-minute row was 94.9%.
- Class agreement with the manual count was about 86% to 88%.
- East to west was 1.2% under. West to east was 4.2% under.
It is not 99%, and I do not claim it is.
What I Learned
- Parked cars are the quiet error. The first count of a road came out about 12% high. Parked cars on a drive and the same van detected twice in nearly the same box were the cause. Fixing that was worth more than any model change.
- A faster setting is not a free setting. A fast path once lost 21% of vehicles without any visible sign. Every speed change is now checked against an every-frame run on the same footage, and against known cyclists and motorbikes.
- Fog and "enhancement" made detection worse. Dehazing a fogged lens cut the frames with detections by about 80%. The honest answer for those windows is "low confidence", not a cleaner picture.
- Some of the gap is in the reference. Where the manual count and the machine disagreed in dense platoons, checking each vehicle showed the manual count had missed some. Car or van for a pickup or a small van is a policy call that needs a written rule from the client.
- The review queue is the product. Reviewers agreed with the machine on 98% of verified vehicles, so I loosened the thresholds and flag only the real coin flips. A queue that flags too much is as bad as a count that is wrong.
What I Do Not Claim
- A named council or client deployment
- Real-time counting. It is built for surveys that are processed afterwards
- Accuracy better than the figures above, or accuracy on footage that is not like the survey day I measured
- That I wrote the code by hand. I directed it and reviewed it
→ AI Enablement for how I work with LLM tooling → Independent Builds for the other tools I run → Contact to see a walkthrough